Home
Archives
RSS
About
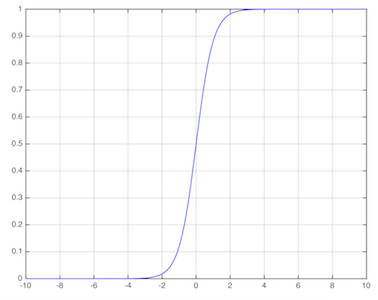
Plot Sigmoid in Matlab
2015-12-24 Beijing
a=2;
x=-10:0.1:10;
y=1./[1+exp(-a.*x)];
plot(x,y,'b');
grid on;
Previous
Next
Please enable JavaScript to view the
comments powered by Disqus.